ot
ラベル 価値評価 の投稿を表示しています。 すべての投稿を表示

2020年11月12日木曜日

衰颯すいさつの景象は、就ちすなわち盛満の中に在り(GMO)

0 件のコメント:
ジェレミー・グランサムのファンドGMOが最近公開した文書のなかに、バリュー志向投資の不振ぶりを取り上げたものがあったので、一部をご紹介します。Covid-19の影響を追い風としたグロース志向投資が相対的に伸長する現状を、1999年になぞらえて鳥瞰しています。(日本語は拙訳)

なお、本文書では割安な例のひとつとしてMSCI Emerging Value Indexをあげています。MSCIのWebサイトで同指数の構成銘柄および比率を確認すると、最大銘柄がサムスン電子で2.85%、第2位がインドのリライアンスで2.71%、第3位が中国建設銀行で2.27%でした(2020年10月30日付資料)。たしかに代表的な人気銘柄には集中しておらず、相対的に割安な比較的大型の銘柄に分散されているようです。

TONIGHT, WE LEAVE THE PARTY LIKE IT’S 1999 (GMO)

1999年当時と同様に、現在のグロース志向投資はバリュー志向の成績を圧倒

1990年代の終盤に、バリュー志向の運用者は守りに入っていました。彼らの掲げるバリュー志向は、5年以上も前から不人気でした。バリュー型運用で名高いファンドは顧客が流出し続け、次第に閉設されていきました。彼らの顧客は「長期的にみればバリュー志向が勝つ」との信念に従っていたものの、ラッセル1000バリュー指数の成績をその親類たるグロース指数と比較すると、1999年に先立つ11年間のうちの7年間で大幅に負けていたのです。数知れぬほどの学術論文が「バリューの死」を謳いました。もちろん最終的には平均回帰の力がはたらき、バリュー志向は7年連続でグロース志向に大差をつけることとなります。初期の苦しみを辛抱できた投資家は、最終的には報われました。バリュー志向は1999年から2006年の間に、グロース志向に対して都合99%の差をつけました。

(中略)

今日に目を転じても、当時と同じリズムが刻まれています。有名で定評あるバリュー型ファンドは店仕舞いをつづけています。バリュー投資家はなおも苦しみ続け、成績はますます離されるばかりです。バリュー志向の成績がグロース志向に劣った年はこの11年間で8回になり、年率でみた負け幅も悪化しています。図3には直近5年間の状況を記しています。今日と1999年当時が奇妙なまでに一致している様子が示されています。


(中略)

これでもまだ痛みが足りないでしょうか。それでは2020年の3月23日に始まって夏のあいだを通して継続した、Covid-19によるグロース志向の急上昇をみてみましょう。3月23日から8月31日までの113日間におけるグロース志向の上昇幅は77%に達し、32%の成績差をつけてバリュー志向を打ち砕きました(これは標準偏差4.5になるできごとで、403年間に一度しか発生しない計算になります。図4を参照のこと)。ここで重要なのは、グロース志向のあげた好成績がファンダメンタルズによって正当化できない点です。今回の例はわたしたちがこれまで観察してきたなかで、価値評価の乖離幅が最も広くなったひとつとなりました。それゆえに当社は「今こそバリュー志向を受け容れる時機であり、敬遠する時機ではない」と確信しています。1999年以降の時期と同様に、「最終的に平均回帰が生じたときには、正しい側にいたい」と投資家は考えることでしょう。


Growth Trouncing Value Today…Just Like 1999

In the late 1990s, Value managers were on the defensive. The Value style had been out of favor for more than half a decade. Well-known Value firms were losing clients and going out of business. Clients had been led to believe that “in the long run, Value wins.”Yet by 1999, the Russell 1000 Value Index had underperformed its growth cousin in 7 of the preceding 11 years, and by huge margins. Countless academic papers were proclaiming the “Death of Value.” Ultimately, of course, mean reversion worked, and Value went on to trounce Growth seven years in a row; despite the early pain, patient investors were ultimately rewarded for their perseverance. From 1999 to 2006, Value beat Growth by a cumulative 99%.

(snip)

Fast forward to today and the same rhymes are echoing. Well-known and established Value shops are calling it quits. The pain for Value investors has lasted even longer and performance spreads are even worse: Value has lost to Growth in 8 of the last 11 calendar years and by even wider margins. Exhibit 3 focuses on the last 5 years, drawing eerie parallels between today and 1999.

(snip)

Not painful enough? Enter the Covid-19 Growth rally of 2020, which started on March 23 and continued all summer. From March 23 to August 31 - a 113-day run - Growth was up 77%, beating Value by a soul-crushing 32% cumulatively (a 4.5 sigma event, which officially happens once every 403 years; see Exhibit 4). This outperformance of Growth, importantly, has not been justified by the fundamentals, resulting in one of the widest valuation spreads we’ve ever witnessed. We believe this is a time for leaning into Value, not away from it. When mean reversion ultimately occurs, just as it did in the post-1999 period, investors will want to be on the right side of that trade.

備考です。標題は、最近読んでいる本『菜根譚』の前集118から採りました。現代語訳は、「総て物事が衰えるきざしというものは、いきおいの盛大な時に動き始めている」になります(講談社、久須本文雄訳より)。なお同書の文章は、機会があればあらためてご紹介したいと思います。

2020年7月8日水曜日

2020年バークシャー株主総会(41)航空業界に残る問題

0 件のコメント:
バークシャー・ハサウェイの株主総会より、航空業界への投資を引き揚げた件についてです。前回分の投稿はこちらです。(日本語は拙訳)

本当のところ、航空会社のCEOという仕事は楽しいものではありません。しかし当社が買ったどの会社もよく経営されていました。たくさんのことを適切に遂行していました。なんといっても難しい事業です。毎日何百万人もの人が関わっており、そのうちの1%の人にまずいことがあれば、ずいぶんと残念な気持ちになってしまいます。ですから、航空会社のCEOの座に就いている人をうらやましいと思ったことはありません。特に今回のような時期においては、なおさらです。基本的には「飛ぶな」と言われている業界です。わたしも「しばらくは飛行機禁止」と言われました。飛行が再開されるのを期待しております。ただし定期便ではないかもしれませんが、それは別の話題になりますね。わたしの思いこみかもしれませんし、そうであってほしいとは思いますが、航空業界は非常に大きく変化したと思います。4社のそれぞれが平均100億から120億ドル以上の借入れをすると予想されることを考えると、明らかに実状が変わってしまいました。

その借金は、一定の期間にわたって利益から返済しなければなりません。つまりそのようなことになれば、100億から120億ドルの損失になります。新株を売るか、新株予約権を売らざるを得ない事態も考えられます。それでは逆に悪くなってしまいます。飛行機を使う人が増えることで、2,3年後には旅客マイルが昨年の水準に戻るのかどうか、わたしには判断できません。そうなるかもしれないし、ならないかもしれません。航空会社自体にはまったく問題がないことがわかったとしても、わたしにとって業界の未来はずいぶんと曖昧なものになってしまいました。つまり今回は確率の低い事象が起こったわけです。そのことで特に旅行業界やホテル業界、クルーズ業界、テーマパーク業界が傷を負いましたが、特にひどいのが航空業界でした。しかし商売が7割から8割回復したとしても、航空業界には依然として問題が残ります。航空機が消えずに残っている点です。

(Warren Buffett 01:43:01)

I mean, believe me, no joy being a CEO of an airline, but the companies we bought are well managed. They did a lot of things right. It's a very, very, very difficult business because you're dealing with millions of people every day, and if something goes wrong for 1% of them, they are very unhappy. So I don't envy anybody the job of being CEO of an airline, but I particularly don't enjoy being it in a period like this, where essentially nobody... People have been told basically not to fly. I've been told not to fly for a while. I'm looking forward to flying them. May not fly commercial, but that's another question. The airline business, and I may be wrong and I hope I'm wrong, but I think it changed in a very major way, and it's obviously changed in the fact that there're four companies are each going to borrow perhaps an average of at least 10 or 12 billion each.

(Warren Buffett 01:44:11)

You have to pay that back out of earnings over some period of time. I mean, you're 10 or $12 billion worse off if that happens. And of course in some cases they're having to sell stock or sell the right to buy a stock at these prices. And that takes away from the upside down. And I don't know whether it's two or three years from now that as many people will fly as many passenger miles as they did last year. They may and they may not, but the future is much less clear to me, [inaudible 00:02:52], how the business will turn out through absolutely no fault of the airlines themselves. That's something that was a low probability event happened, and it happened to hurt particularly the travel business, the hotel business, cruise business, the theme park business, but the airline business in particular. And of course the airline business has the problem that if the business comes back 70% or 80%, the aircraft don't disappear.

2020年7月7日火曜日

2020年バークシャー株主総会(40)わたしの間違いでした

0 件のコメント:
バークシャー・ハサウェイの株主総会より、ウォーレン・バフェットの実質的な謝罪会見です。 このように誠実な態度を示せるリーダーのもとでは、真っ当な文化が育まれていると期待したいものです。前回分の投稿はこちらです。(日本語は拙訳)

<ウォーレン・バフェット> そうしたのは基本的に、だれかが目標価格を変更したり、今期の利益予想を変更したことで、「株式市場は下落するか、今の状態で進むだろう」と考えるようになったからではありません。「企業の価値を評価する際に自分がまちがっていた」と判断したからです。それは原因が究明できる失敗でした。株式を買ったときには、確率で重みづけした上で決定をくだしました。そして航空業界にわたって投資していた時には、十分な見返りを得ていました。

最大手の航空会社4社を合算したとして、その10%ほどを購入しました。4月に実行[売却]したのは100%ではないですが、大手4社の10%を購入するために70億から80億ドルを支払いました。

当社としては、10億ドルほどの利益を得ていると考えていました。10億ドルの配当金を受け取ったわけではないですが、持分に相当する利益の額はおよそ10億ドルだとみなしていました。そしてある程度の期間でみれば、その金額を上回る年のほうが下回る年よりも多いだろうと予想していました。当然ながら周期的な変動はあるでしょうが、会社全体を買ったと想定して利益のことを考えていました。しかし当社はニューヨーク証券取引所で株式を買ったので、実際には4社全体の10%程度しか買えませんでした。わたしどもの心のなかでは、その事業を本当に保有しているかのように考えてきました。そして今回、わたし自身が事業のことをまちがってとらえていたという結果になりました。優秀なる4名のCEO諸氏が失敗をおかしたわけではありません。

(Warren Buffett 01:41:07)

And that's basically, that isn't because we thought the stock market was going to go down or anything of this order because somebody changes their target price or they change this year's earnings forecast. I just decided that I'd made a mistake in evaluating. That was an understandable mistake. It was a probability-weighted decision when we bought that, we were getting an attractive amount for our money when investing across the airlines business.

(Warren Buffett 01:41:43)

So we bought roughly 10% of the four largest airlines, and we probably... This is not 100% of what we did in April, but we probably paid $7 or $8 billion and then somewhere between $7 and $8 billion to own 10-

(Warren Buffett 01:42:03)

And somewhere between seven and eight billion to own 10% of the four large companies in the airline business, and we felt for that, we were getting a billion dollars roughly of earnings. Now we weren't getting a billion dollars of dividends, but we felt our share of the underlying earnings was a billion dollars and we felt that that number was more likely to go up than down over a period of time. It would be cyclical obviously, but it was as if we bought the whole company. But we bought it through the New York Stock Exchange, and we can only effectively buy 10% roughly of the four. And we treat it mentally exactly as if we were buying a business. And it turned out I was wrong about that business because of something that was not in any way the fault of four excellent CEOs.

今回の発言で個人的に注目したのは、チャーリー・マンガーの指摘を裏付ける箇所でした。今となっては基本的なことですが、それでも事実が確認できるというのはうれしいことですね。

反射的に、にょきにょきと枝をのばす(チャーリー・マンガー)

2020年7月6日月曜日

企業の成長性と価値評価の関係(後)(マイケル・モーブッシン)

0 件のコメント:
マイケル・モーブッシンのエッセイより、今回で最後です。「成長投資」という言葉を株主の立場からみつめなおす話題です。あっさりとした内容の文章に読めますが、企業へ長期的に投資をして大きな利益をあげる上で、この話題は核心になるものだと、個人的には考えています。前回分の投稿はこちらです。(日本語は拙訳)

<ROIIC>
さらにここからは、ROIICの予想値が変化するとどのような影響がでるのか見てみよう。NOPAT(税引後営業利益)成長率が10%と仮定した状況に戻って、異なるROIICを設定することで保証PER倍率がどうなるのか検討していく。

ROIIC. We now turn to seeing the impact of changing assumptions about ROIIC. We’ll revert back to our 10 percent baseline NOPAT growth and consider the warranted P/E multiples assuming different ROIICs.

ここでいったん、文中で登場する用語を説明する文章に移ります。「標準PER倍率(commodity P/E multiple)」という用語についてです。

標準PER倍率(commodity P/E multiple)の基礎的な例から始めよう。この値は「年あたり1ドルの利益を生み出すが、今後は新たな価値を創出しない永久債として扱うべきもの」に対して支払う金額の倍率である。これを求めるには、資本コストの逆数を乗算すればよい。たとえば資本コストが8%であれば、標準PER倍率は12.5になる(1 / 0.08 = 12.5)。

Let’s start with the basic example of the commodity P/E multiple. This is the multiple you should pay for $1 of earnings into perpetuity assuming no value creation. You calculate the multiple by taking the inverse of the cost of equity capital. For example, if the cost of equity is 8 percent, the commodity P/E multiple is 12.5 (1/.08 = 12.5).

以下、本文に戻ります。

図4にその結果を示す。この条件における標準PER倍率が14.9であることに留意してほしい[6.7%の逆数]。それでは考えを進めてみよう。ROIICは、予想成長率を達成するために資金をどれだけ投下すべきかを示している。ROIICが高ければ、成長に対する投資はそれほど必要ではない。つまり、株主に回すことのできる現金が多く残る。その反対にROIICが低いと、成長を果たすための資金が余計にかかり、株主用の現金が少なくなる。


バフェットは、成長することが「好影響になることもあるし、悪影響になることもある」と付け加えた。ROIICが資本コストを下回っていれば、成長は[価値に対して]悪影響を与える。そのような企業は1ドルの資本を費やすことで、1ドル未満の価値を手にいれるのだ。その場合、企業の成長が急速であるほど、より多くの財産が失われていくことになる。

上記の図は「ROIICが資本コスト6.7%に満たないと、株価のPER倍率が標準倍率を下回る」ことを示している。企業買収の例がこれに当てはまる。一般に買収を実現することで、買い手からすれば利益は増加するものの、[企業]価値は下落する。つまり「ROIICの低い投資を実施している企業は、株価倍率を標準倍率へ押し下げている」と、みなすことができるだろう。

Exhibit 4 shows the results. Recall that the commodity P/E is 14.9. Here’s the way to think about it: ROIIC tells you how much you have to invest to achieve an assumed growth rate. A high ROIIC means you don’t need to invest much to grow, which means there’s more cash left over for shareholders. A low ROIIC means you have to invest a lot of capital to grow, leaving little for the owners.

Buffett added that the impact of growth “can be negative as well as positive.” Growth is a negative when the ROIIC is below the cost of capital. In that case, a company is spending $1 worth of capital to attain less than $1 of value. The faster the company grows the more wealth it destroys.

The exhibit shows that an ROIIC below the cost of capital of 6.7 percent yields a P/E multiple below the commodity multiple. Acquisitions are again a case in point. For buyers, M&A deals commonly add to earnings growth but subtract from value. You can think of low-ROIIC investments as pushing down the P/E multiple of a company’s stock toward the commodity multiple.

2020年7月2日木曜日

企業の成長性と価値評価の関係(中)(マイケル・モーブッシン)

0 件のコメント:
マイケル・モーブッシンのエッセイをもう少し取り上げます。今回の文章では、前回分の投稿で取り上げた割引キャッシュフロー・モデルを使い、事業の予想成長率が低下したときの価値評価をみています。(日本語は拙訳)

<成長性>
それではここで、予想成長率を10%から7%へと低下させてみよう。なお、基準年の利益を100ドルとしている。

今期末の予想利益PER
利益成長率変更前変更後変更前変更後
10% → 7%$110 $107 32.3 24.9


注目すべき点は、利益成長率が2.7%しか低下していないのに、そこから保証されるPER倍率は激しく急落して、22.9%も減少している点だ。投資家というものはPER倍率を算出する際に、現在の株価と来年[つまり今期末]の利益を使うことが多い。その結果、「次の利益はわずかな変化にとどまるようだが、それと比較すると市場は過剰に反応している」と思いこむことがある。しかし、PER倍率が大きく下落したように見えても、成長の足取りに対する期待がしぼんでしまえば、それは完全に正当化される。

(中略)

上述した計算は、バフェットが指摘した次のことを裏付けている。「価値(バリュー)を求める計算には、成長(グロース)という変数を必ず含んでいる。その変数は計算結果に対して、『軽微』以上『甚大』以下の影響を及ぼす」。資本コスト程度のリターンしか得られない事業では、価値を求める上で成長性はほとんど違いをもたらさない。しかし、投下資本に対して高いリターンをあげる事業では、成長性は価値を大きく増大させる。

Growth. Let’s start by reducing the growth rate from 10 percent to 7 percent. We’ll assume the base year earnings are $100.

Next year’s earningsP/E
GrowthBeforeAfterBeforeAfter
10% → 7%$110 $107 32.3 24.9


Note that the change in growth reduces next year’s earnings by only 2.7 percent, but that the warranted P/E multiple drops a more precipitous 22.9 percent. Investors often calculate the P/E multiple using the current price and next year’s earnings. As a result, they sometimes believe that the market overreacts to what appear to be modest changes in the near-term earnings. But if expectations for the trajectory of growth really do shift down, the large apparent drop in the P/E multiple is completely justified.

(snip)

This calculation substantiates Buffett’s point that, “Growth is always a component in the calculation of value, constituting a variable whose importance can range from negligible to enormous.” Growth makes little difference for businesses that earn a return close to the cost of capital but is a huge amplifier of value for high-return businesses.

2020年6月28日日曜日

企業の成長性と価値評価の関係(前補)(マイケル・モーブッシン)

3 件のコメント:
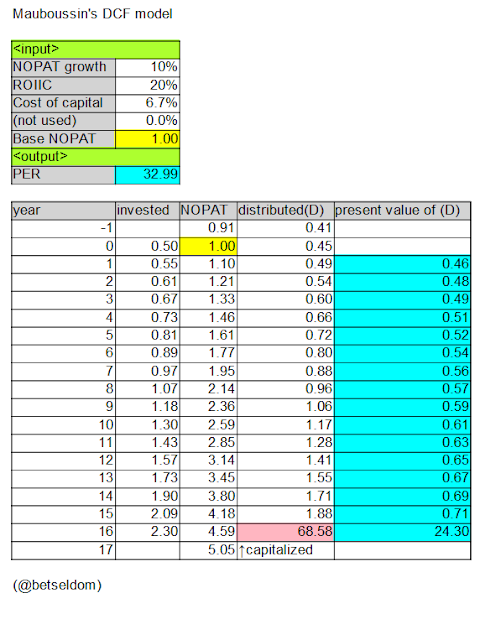
マイケル・モーブッシンに関する前回分の投稿で、コメント欄にてご質問がありました。「計算結果のPERが合わない」とのお問い合わせでしたが、今回の投稿はその返答になります。以下の図は、前回分投稿の内容に基づいてわたしが作成したスプレッドシートです。NOPAT成長率が10%と15%の2つの例を計算して、それぞれ掲載しています。

どちらの図でも出典元のエッセイで示されていたPERの数字(32.3および52.2)と合致していませんが、おおよそ合っていると勝手に判断して、それ以上は深入りしていません(計算途中の端数まるめ処理を調整するなど)。単純なモデルですが冷静にながめてみると、当たり前のことが数値になって現れており、ふだんの価値評価プロセスを見直す材料になりそうです。

(NOPAT成長率が10%の場合)

DCFモデル(NOPAT成長率20%)

(NOPAT成長率が15%の場合)

2020年6月26日金曜日

企業の成長性と価値評価の関係(前)(マイケル・モーブッシン)

2 件のコメント:
少し前の投稿で取り上げたマイケル・モーブッシンのエッセイでは、企業価値を評価する上での成長性や金利の影響について持論を展開しています。今回ご紹介するのは、PERのようなわかりやすい評価指標を使う上での注意を促すような文章です。(日本語は拙訳)

計算式 

それでは、PERが30台前半になるように入力値を調節した上で、割引キャッシュフロー・モデルを使って検討してみよう。 以下に、用語の定義と初期条件を記しておく。

・NOPAT(税引後営業利益)が年率10%で増加すると仮定した。NOPATとは、財務的な借入れに頼らないで企業があげる損益を示す金額である。

・ROIIC(増分投下資本利益率)が20%と仮定した。ROIICの定義は、今期と比較した来期NOPATの増分を、今期中に支出される投資額で除した割合である。たとえば、来期のNOPATが10ドル分増加すると見込まれ、今期中に50ドルを事業に投資するとき、ROIICは20%になる(=10/50)。ここで注意すべき点は、投資した資金の仕分け先が費用か資産かは問わない点である。ただし、若干の税効果は別とする。

・株主資本コストを6.7%と仮定した。これはアシュワス・ダモダラン[ニューヨーク大学スターン・スクールの教授]が2020年2月1日時点で見積もった値である。この指標は、想定されるリスクに対して投資家が期待しているリターンを測るものである。そのため無リスク金利1.5%に、株式リスク・プレミアムの推計値5.2%を加算した値となっている。話を単純にするため、対象企業の資本調達先は、株主からの出資だけとしている。なお、債券が加わっていると計算が若干やっかいになるが、筋書きが変わることはない。

・本モデルでは15年間で得られるキャッシュフローの価値を算出し、その後の期間については残存価値を見積もるために永久債として扱う。なお、NOPATを16年目にも計算している。これは15年目に実施された投資の成果を反映するためであり、さらにそれを株主資本コストを使って還元している。そうして得られた数値を現在価値へ割り引く。

以下に、このモデルにおける入力および出力値を示す。

(入力値)
NOPAT(税引後営業利益)の増加率: 10%
ROIIC(増分投下資本利益率): 20%
資本コスト: 6.7%

(出力値)
PER: 32.3

ここで増加率を15%にして他の値はそのままだと、以下のような結果が得られる。

(入力値)
NOPATの増加率: 15%
ROIIC: 20%
資本コスト: 6.7%

(出力値)
PER: 52.2

それでは次に、それらの初期条件を変化させることでPER倍率にどのような影響をもたらすのか確認しよう。[価値評価の際にPERのような]倍率を使っている投資家のほとんどは基礎的な仮定を熟慮していないため、概して彼らが予想する以上の変化があらわれる。

(つづく)

The Math

We start by calibrating our discounted cash flow model with inputs that yield a P/E multiple in the low 30s. Here are the definitions and the initial assumptions:

- We assume net operating profit after tax (NOPAT) will grow 10 percent per annum. NOPAT represents the cash profits a company would earn if it had no financial leverage.

- We assume a return on incremental invested capital (ROIIC) of 20 percent. ROIIC is defined as the change in NOPAT from this year to next year divided by this year’s investment. For example, if NOPAT grows by $10 next year and the company invests $50 this year, the ROIIC is 20 percent (10/50). Note that it does not matter if the investment is expensed or capitalized, save for some effect on taxes.

- We assume the cost of equity capital to be 6.7 percent, which was Aswath Damodaran’s estimate as of February 1, 2020. The cost of equity measures the return an investor expects to earn given the assumed risk. As such, the figure is the sum of the risk-free rate of 1.5 percent and an estimated equity risk premium of 5.2 percent. We assume the company is financed solely with equity for simplicity. Adding debt makes the calculations slightly more cumbersome but does not change the story.

- The model values explicit cash flows for 15 years after which it uses a perpetuity to estimate the residual value. Specifically, the model takes NOPAT in year 16, which reflects the benefit of the investment made in year 15, and capitalizes it by the cost of equity. That figure is then discounted to a present value.

Here’s a summary of the inputs and the output:

NOPAT growth: 10%
ROIIC: 20%
Cost of capital: 6.7%
→ P/E: 32.3

If we increase the growth rate to 15 percent and hold everything else constant, we get this result:

NOPAT growth: 15%
ROIIC: 20%
Cost of capital: 6.7%
→ P/E: 52.2

We will now change these assumptions to see what the impact is on the P/E multiple. Because most investors who use multiples do not contemplate foundational assumptions, the changes are larger than they generally expect.

備考です。ROIICの具体的な計算例としては、米マクドナルド社がSECに提出した10-K中の文章が参考になりそうです。

One-year return on incremental invested capital (ROIIC)

また本文中で取り上げられていた割引キャッシュフロー・モデルは、スプレッドシートでおおよそ再現できます。

2018年3月16日金曜日

割引率について(ウォーレン・バフェット)

2 件のコメント:
バリュー投資サイトのGuruFocusで、ウォーレン・バフェットが過去にインタビューで語った内容を取り上げている記事がありましたのでご紹介します(原典は、バリュー投資家にとっておなじみのOID誌です;Outstanding Investor Digest)。今回の文章は短いですが、前2回つづけた投稿(過去記事1, 2)のカギとなるものです。(日本語は拙訳)

Buffett and Munger on Discount Rates and How They Read Annual Reports (Grahamites氏の記事、GuruFocus)

<バフェット> 将来における現金の収支を見積もることができたら、それらの数字を現在価値へと引き直すために、割引率をいくつにすればよいかが問題になります。わたしの感覚では、ほとんどの資産においておそらく長期国債[おそらく30年債]の利回りが最適な数字だと思います。ただしわたしだけでなくチャーリーもそうですが、「金利が低い側にある」という印象を持っているときは、おそらく長期国債の利回りそのものを使おうとは考えないと思います。そのようなときには、ふつう1ポイントか2ポイント追加するかもしれません。しかし、この一連の説明を聞いた方は、長期国債の利回りを使ってみたくなるでしょう。そうだとしたら、株式と債券における経済的な面での違いは事実上なくなります。違っているのは、債券の場合は将来どれだけのキャッシュフローが得られるのか知り得るのに対して、株式の場合は自分でそれを見積もらなければならない点です。これは骨の折れる仕事ですが、ずっと大きな見返りが得られる可能性を秘めています。それゆえ、仮想的な収入には関わりたくないのでしたら、農地やアパートやそういったものを見積もったほうがいいでしょう。少なくとも、わたしたちはそうしています。

Buffett: And once you’ve estimated future cash inflows and outflows, what interest rate do you use to discount that number back to arrive at a present value? My own feeling is that the long-term government rate is probably the most appropriate figure for most assets. And when Charlie and I felt subjectively that interest rates were on the low side – we’d probably be less inclined to be willing to sign up for that long-term government rate. We might add a point or two just generally. But the logic would drive you to use the long-term government rate. If you do that, there is no difference in economic reality between a stock and a bond. The difference is that the bond may tell you what the future cash flows are going to be in the future – whereas with a stock, you have to estimate it. That’s a harder job, but it’s potentially a much more rewarding job. Logically, if you leave out psychic income, that should be the way you evaluate a farm, an apartment house or whatever. And in a general way, Charlie and I do that.

2018年3月12日月曜日

ウォーレン・バフェットの株式投資入門:金利と債券と株式について

0 件のコメント:
「バフェットからの手紙」を公開したウォーレン・バフェットが、恒例となっているベッキー・クイックのインタビューを受けていました。そのなかから、昨年後半にも話題になっていた金利に関する質疑応答を引用してご紹介します。なお長文の段落は、意味段落で適宜改行しました。(日本語は拙訳)

FULL TRANSCRIPT: BILLIONAIRE INVESTOR WARREN BUFFETT SPEAKS WITH CNBC’S BECKY QUICK ON "SQUAWK BOX" TODAY (CNBC)

<質問者: ベッキー・クイック> 株式に強気で来た理由として、現時点では金利の状況もそうだとのご意見ですが、たしか以前に「金利は株価に作用する重力であり、十分に低ければ株価は必ずや上昇する」と言われていましたね。しかし市場では実に奇妙なことが起こっています。雇用に関する報告が良好だといううれしいニュースが出たとたん、突如として不安が漂うようになりました。金利が上昇し、連銀が予想以上に上昇率を高めるのではないかと、みんな心配性になっています。朝起きて確かめる度に、10年物の国債利回りが3%へと戻りつつあります。このことで投資家は、いえ「少なくともトレーダーは」と言うべきですね、何が起きているのだろうと気がかりになっています。この件をどんなふうに捉えていますか。

<ウォーレン・バフェット> そうですね、ベッキー、もし30年物の米国債を買ったとしますよ。するとすべてのクーポンが付いてきます。今は電子的になりましたが、昔はそうだったのです。とにかくクーポンが全部付いてきます。クーポン毎に3%などが支払われるとします。今から30年後までずっとですよ。そして最後になると、額面分の金額を返してくれます。

それでは株式はどうなのかと言いますと。それと同じようなものです。クーポンがたくさん付いてきます。ただし、数字は印刷されていません。その数字を印刷することが、株式を買う投資家のやるべきことなのです。数字が10%だとしましょうか。ほとんどの米国企業は、有形資本比で10%以上の利益をあげています。この債券[的にとらえることのできる株式]が10%だとすれば、3%と書かれている債券よりも、ずっと高い価値があります。しかし米国債が10%であれば、あなたが買った債券[風の株式]の価値は変わります。GMやバークシャー・ハサウェイなどの一部を[株式として]買うということは、現金の形で徐々に戻ってくるわけです。バークシャーの場合はずっと先になりますが、大きな金額になるでしょう。それらがクーポンなのです。そのクーポンをどう考えればいいのか投資家として決断するのは、買うのは自分だからですし、価値を割り引いた金額で買うからです。しかし物差しとしての米国債の利回りが高くなれば、ほかの債券[=株式など]の価値は魅力が薄れます。これが[この手の話題についての]経済的な理屈です。

1982年や83年には長期米国債の利回りが15%になりました。当時ROEが15%だった企業は、そのような環境では簿価分の価値しかありませんでした。30年物のストリップス[=割引債]を買えば、年率15%を確実にできたからです。当時12%の利益を得ていた企業は水準以下だったことになります。しかし現在のように米国債の利回りが3%であれば、12%の利益をあげる企業はすごく素晴らしいと言えます。ですから、そういった企業には法外な値段がついているわけです。

<質問> だから以前に、「3%は15%からほど遠い」とおっしゃったのですね。

<バフェット> そのとおりです。ただし、3%から15%へ上昇した様子を目にしたことはありますが。

<質問> たしかに。その途中で「なんと、2.4%から2.9%へ上がったのね。これは大きな違いだわ」と感じる変曲点がありますか。

<バフェット> その数字はそれほどではないですね。そんなに大きくはないです。

<質問> 過去を振り返れば、まだ...

<バフェット> そのとおりです。

<質問> ...絶対的な意味で大きく変化しておらず、パーセンテージもそれほど上昇していない、と受け止めるべき段階ですか。

<バフェット> ROE12%をあげている企業が再投資をしているのと比べれば、2.4から2.9%へ上昇した数字にはそれほど意味はありません。S&P[500]の数字はそれこそ云十年分もありますが、有形資本比でみてもっと高い数字をあげてきました。ですから、もっと高い値段になっていくわけです。

<質問> その途上で転換点があるのですか。それともそういったものは徐々に減少するのですか。

<バフェット> それはだれにもわかりません。ただし、重力として働きます。つまり「債券の利回りが来年には15%になる」と教えてくれれば、今にも手放したい株がいろいろありますし、15%の債券をたくさん買いたいところです。1982年にそうしていればと思ったりしますが、実際には買いませんでした。

<質問> それでは、もし「来年の長期債は4.5から5%で売買される」と私からお伝えしたら、どうなりますか。

<バフェット> それはたしかに違いますね。しかし例のときに長期債を保有するのは愚かでしたよ。この件は年次報告書で触れていますが、まさしく愚かなことでした[過去記事]。巨大な公的年金基金やその手の機関投資家が、座して債券を保有していました。4%あるいは5%近辺で買ったのかもしれません。しかし3%前後になると、額面以上の価格で売り買いしています。そのような考えかたでは、非常にバカげた行動をとることになります。

BECKY QUICK: And part of the reason that you've been so bullish on equities for many years at this point is the interest rate environment. You've looked at interest rates and said, "Interest rates are gravity on stock prices. And when interest rates are so low, stock prices inevitably are going to climb." There's been this really weird thing that's been happening in the markets. Where all of a sudden, good news that we got from a good jobs report made people start to worry that interest rates were going to climb and that the Fed was going to raise rates more than anticipated. People got really nervous around that. You can still see it every time we get up on the ten year back towards 3%. It gives investors, or at least traders I should say, some concerns about what's happening. How do you kind of gauge all of that?

WARREN BUFFETT: Becky, a bond, if you buy a 30-year government bond, it has a whole bunch of coupons attached. In the old days it does, now it's all electronic. But it has a whole bunch of coupons. And the coupon pays 3%, or whatever it may say. And you know that's what you're going to get between now and 30 years from now. And then they're going to give you the money back.

What is a stock? A stock is the same sort of thing. It has a bunch of coupons. It's just they haven't printed the numbers on them yet. And it's your job as an investor to print those numbers on it. If those numbers say 10% and most American businesses earn over 10% on tangible equity. If they say 10%, that bond is worth a hell of a lot more money than a bond that says 3% on it. But if that government bond goes to 10%, it changes the value of this equity bond that, in effect, you're buying. When you buy an interest in General Motors or Berkshire Hathaway or anything, you are buying something that, over time, is going to return cash to you. Maybe a long time in terms of Berkshire, but it'll be bigger numbers. And those are the coupons. And your job as an investor to decide what you think those coupons will be because that's what you're buying. And you're buying the discounted value. And the higher the yardstick goes, and the yardstick is government bonds, the less attractive these other bonds look. That's just fundamental economics.

So in 1982 or '83, when the long government bond got to 15%, a company that was earning 15% on equity was worth no more than book value under those circumstances because you could buy a 30-year strip of bonds and guarantee yourself for 15% a year. And a business that earned 12%, it was a sub-par business then. But a business that earns 12% when the government bond is 3% is one hell of a business now. And that's why they sell for very fancy prices.

BECKY QUICK: So 3% is a long way from 15% that you were just talking about.

WARREN BUFFETT: Absolutely. But I watched it go from 3-15% though, too.

BECKY QUICK: Right. Is there an inflection point on that way because people think, "Oh my gosh, we've gone from 2.4% to 2.9% and that is a big difference."

WARREN BUFFETT: It isn't much. That's not much.

BECKY QUICK: Historically speaking, that's still the way we should be measuring these things

WARREN BUFFETT: Absolutely.

BECKY QUICK: Not on the absolute movement or the percentage gain movement over time?

WARREN BUFFETT: 2.4-2.9% is nothing if you're comparing it with businesses that earn 12% on equity and reinvest. And the S&P, you can just look at the figures for decades, has earned on tangible equity, it's earned a lot more than that. And it translates into more, higher prices than it should.

BECKY QUICK: Is there a tipping point along the way, or is it a gradual decline in terms of these things?

WARREN BUFFETT: Nobody knows. Yeah. But it is gravity. I mean, if you told me interest rates were going to be 15% next year on bonds, you know, there's a lot of equities I wouldn't want to own now. And I would buy a lot of governments at 15%, and I kind of wish I had in 1982, but I didn't.

BECKY QUICK: If I told you that the long bond was going to trade at 4.5-5% next year, what would you (think)?

WARREN BUFFETT: It makes a difference. But it's been idiotic to own long bonds during the last, you know, I talk about this in the report. It's just been idiotic. And big, public pension funds and all that, they sat there and they owned bonds. Now, they may have bought them on a 4% or 5% basis. But if they go to a 3% basis, they're selling way above par. The way people think about it is that they do some very silly things.

2018年3月8日木曜日

割引率および割安度について(ウォーリー・ワイツ)

0 件のコメント:
バリュー・ファンドのマネージャーであるウォーリー・ワイツのインタビュー記事をひきつづき引用します(前回分の投稿はこちら)。今回の話題はDCF法で使う「割引率」と、適正価格からどれだけ割安であれば購入に踏み切るのかの「割安度」の話です。オーソドックスな内容ですが、取り組む上での工夫や具体的な数字に触れていて、参考になります。(日本語は拙訳)

<質問> 調査対象の企業に対しては、どれも同じ割引率を使いますか。それともリスクや他の要因にもとづいて必要なリターン率を決めますか[=つまり割引率を適宜調整するか]。

<ワイツ> 同じ割引率を使って[評価]モデルを作成しています。現在適用しているのは9%です。しかし各企業には「事業の質」を評価した異なった点数を与えますから、モデル中で正当化された「残存倍率」[残存価値を算出する方法で使われる乗数]にそれが影響してきます。また、将来の予想キャッシュフローがどれだけ正確なのか、その信頼性は企業によって異なります。そのため、ポートフォリオ・マネージャーが「価値」からどれだけ割り引くかは、各々異なってきます。他の人たちも、そういったものと同様の要因を調整する際に、それぞれの割引率を使っているはずだと思います。ただし、企業分析中の異なった段階においてですが。

<質問> すばらしい企業には妥当な金額を出すのですか。そうでなければ、少なくとも安全余裕をどの程度とりますか。

<ワイツ> チャーリー・マンガーが示してきた「素晴らしい企業をそこそこの値段で買う」とする見識を、ウォーレン・バフェットは確信していますね。その「素晴らしい」企業と、それよりもずっと普通の企業に違いはありますが、もし価値を正しく測ることができるのであれば、その違いは評価プロセスにおいてひとまとめにすべきです。評価額から安全をみるための余裕率(私たちの標準としては最低でも30%)を妥協すべきではありません。

しかし、あらゆる株が高く、絶対的な意味で安いものがないようなときは、相対的価値という考えがしのびこんできます。手元に現金が残っていても私たちのように気にかけない運用者は、数少ないと思います(現金比率が20から25%になることもあります)。しかし今日の市場では、実のところ私たちががっちり保有している株式に、購入時の決まりとして価格対価値比を70%とした制限をずっと超えたものがあります。「70%以上の値段でもポジションを取り始めたり買い増ししたりするのか」、わたしたちもそう見られるようになってしまいました。そういった数字に何か特別な意味合いはないのですが、しかし安値で買ったときのほうが(それが安全余裕です)、良いリターンを達成する確率が高いことはわかっています。

JR: Do you use the same discount rate for every business you are researching or do you adjust your required rate of return based on risk and/or other factors?

WW: We use the same discount rate, currently 9%, for each of our models. However, we use varying “business quality” scores for different companies and this impacts the warranted “terminal multiple” in the model. Also, our confidence in the accuracy of the estimates of future cash flows will vary from company to company, and the portfolio manager will vary their required (price) discount from “value” accordingly. We believe that others who use varying discount rates are adjusting for these same factors, but at a different stage of the analysis.

JR: Will you pay a fair price for a great business? If not, what is the minimum margin of safety you require?

WW: Warren Buffett credits Charlie Munger with convincing him of the wisdom of “paying a fair price for a great business.” The differences between a “great” business and a more ordinary one should be incorporated in the valuation process so if value (V) is measured correctly, we shouldn’t have to compromise on the discount from full value that we seek (generally at least a 30% discount).

However, when all stocks seem expensive and nothing seems cheap in absolute terms, the concept of relative value creeps in. We are willing to hold more in cash reserves than most managers (sometimes as much as 20-25%), but in today’s market, we find ourselves holding onto stocks with price-to-value (P/V) ratios well above our 70% threshold for buying. We have even been known to pay over 70% to initiate or add to a position. There is nothing magic about any of these numbers, but we know that the odds of earning high returns are better when we buy at a cheaper price (the margin of safety).

2018年2月28日水曜日

2017年度バフェットからの手紙(3)バカだねと思われることが必要なとき

0 件のコメント:
2017年度「バフェットからの手紙」から、前回に続いて「賭け」の話題です。(日本語は拙訳)

最終的な「賭け」の結果は、次のようになりました。

暦年 ファンドA ファンドB ファンドC ファンドD ファンドE S&Pファンド
2008 -16.5% -22.3% -21.3% -29.3% -30.1% -37.0%
2009 11.3% 14.5% 21.4% 16.5% 16.8% 26.6%
2010 5.9% 6.8% 13.3% 4.9% 11.9% 15.1%
2011 -6.3% -1.3% 5.9% -6.3% -2.8% 2.1%
2012 3.4% 9.6% 5.7% 6.2% 9.1% 16.0%
2013 10.5% 15.2% 8.8% 14.2% 14.4% 32.3%
2014 4.7% 4.0% 18.9% 0.7% -2.1% 13.6%
2015 1.6% 2.5% 5.4% 1.4% -5.0% 1.4%
2016 -3.2% 1.9% -1.7% 2.5% 4.4% 11.9%
2017 12.2% 10.6% 15.6% N/A 18.0% 21.8%
累計 21.7% 42.3% 87.7% 2.8% 27.0% 125.8%
年率 2.0% 3.6% 6.5% 0.3% 2.4% 8.5%

(注)プロテジェ・パートナーズとの合意によって、各ファンド・オブ・ファンズの名称は非公開としました。ただしわたし自身は、年次監査報告を受け取っています。なお2016年のファンドA・B・Cの数字は、昨年記載した内容から若干改訂しました。またファンドDは2017年中に解散したため、年間損益率の平均値は運営されていた9年間の成績をもとに算出してあります。

5本のファンド・オブ・ファンズは素早い駆け出しをみせ、2008年にはどれもがインデックス・ファンドを負かしました。しかしその後はまるでうまくいきませんでした。つづく9年間はどの年も、ファンド・オブ・ファンズ全体としてみればインデックス・ファンドから遅れを取ったのです。

あえて申し上げておきますが、その10年の間で株式市場の動向に異例なところは何もありませんでした。2007年の終わりごろに投資の「専門家」各氏に依頼して、普通株の長期的収益率を予想してもらえば、その平均値は8.5%に近い数字になったでしょう。これはS&P500が実際に記録した数字です。そのような環境であれば、儲けをあげるのは易しいことです。実際のところ、ウォール街の「助力者」たちが手にした総額は、びっくり仰天の金額でした。しかしながらその人たちが大いに潤った一方で、彼らに資金を投じた多くの投資家にとっては、失われた10年間となりました。

投資の成績はたゆたうものですが、手数料を遠慮されることはありません。

* * * * * * * * * * * *

今回の「賭け」によって、投資におけるもうひとつの重要な教訓があらわになりました。市場はおおむね合理的ですが、ときにおかしな行動をとります。その際に現れる機会をつかむには、まばゆい知性は必要ありません。経済学の学位も、アルファやベータといったウォール街で使われる専門用語になじんでいる必要もありません。そうではなく投資家に必要なのは、群集心理にみられる恐怖や熱狂から距離をおき、一握りの単純なファンダメンタルを凝視できる力です。かなりの期間にわたって、平凡と思われたりあるいはアホとさえ思われたりする道を、あえて選べる心持ちも欠かせません。

プロテジェとわたしは当初、最終的に必要な100万ドルを用意するために、財務省発行の額面50万ドルの割引債(ストリップスと呼ばれることがあります)をそれぞれ購入しました。その債券を買う価格が、それぞれ31万8,250ドルだったのです。これは1ドルに対して64セントを若干下回る値段でした。この金額を払うことで、10年後に50万ドルずつを受け取る算段でした。

その名称からおわかりになると思いますが、両者が買った債券には利子が支払われません。しかし(割り引いた値段で購入しているため)、満期まで保有すれば年率にして4.56%の利益が得られます。当初は年ごとに得られるリターンだけを考えており、2017年末に債券が満期を迎えることで、賭けの勝者側が指定する慈善先に100万ドルを贈るつもりでした。

しかし購入した後になって、債券市場で実に奇妙なことが起こりました。2012年の11月に、満期日まで残り5年ほどとなったわたしたちの債券が、額面価格の95.7%で買われていたのです。その値段になると、満期までの利回りは年率1%以下でした。正確には0.88%でした。

なんとも貧相なリターンなので、わたしたちが債券に投資していることが、米国株に投資するのとくらべてひどく間抜けなように思えました。S&P500であれば、すなわちそれは「米国におけるビジネスを時価総額によって適宜重みづけした大断面」のようなものですが、株主資本(つまり純資産)利益率にして年率10%を大きく上回る稼ぎを、長期間にわたってあげてきたのですから。

2012年11月、つまりわたしたちがこの件を考え直した時点で、S&P500に投資することで受け取れる配当金のリターンは年率2.5%、つまりわたしたちが購入した財務省証券の利回りの約3倍でした。しかも配当金が増額されていくのは、まず間違いないと言えました。それだけではなく、500社を構成する各社は莫大な資金を留保していました。各社はその資金を使って事業を拡大したり、よくあるように自社株を買い戻すことでしょう。どちらであろうと、いずれは1株当たり利益を大幅に増加させるはずです。1776年以来いつもそうだったように、いかなる困難な時期が来ようと、米国経済は前進し続けてきたのです。

2012年の末に債券と株式の間で評価の釣り合いが大幅に乱れたことで、プロテジェとわたしは次の点を合意しました。「両者が購入した債券を当初の予定より5年早く売却し、得られた資金でバークシャーのB株を11,200株買うこと」です。その結果、ガールズ・インクのオマハ事務所が先月受け取った金額は、当初望まれていた100万ドルではなく、222万2,279ドルとなりました。

お断りしておきますが、2012年に債券から乗り換えた後のバークシャーが、きわだった業績を残したわけではありません。しかし傑出する必要はなかったのです。結局のところ、バークシャー株からあがる利益が、年間利回り0.88%の債券に勝てばいいだけのことでした。獅子奮迅の働きは不要でした。

債券をバークシャー株に交換することの唯一のリスクは、2017年末の株式市場が極端に弱い事態にめぐり合ってしまうことでした。しかしその可能性は非常に小さい(いつであろうといくらかは存在します)だろうと、両者ともに考えていました。そう結論付けた理由は2つあります。ひとつめは、2012年末のバークシャー株が妥当な値段だったことです。ふたつめは、「賭け」が終わりとなるまでの5年間のうちに、バークシャーがほぼ確実に資産を大幅に蓄積させると考えられたからです。ただし、そうではあっても交換によって生じる、今回の慈善に関するあらゆるリスクを排除するために、2017年末にバークシャーの11,200株を売却しても100万ドルに満たない場合には、わたしが不足分を埋め合わせる旨、合意しました。(PDFファイル11ページ目)

(この節、まだつづきます)

Here’s the final scorecard for the bet:

[The performance chart is omitted by the blog author.]

Footnote: Under my agreement with Protege Partners, the names of these funds-of-funds have never been publicly disclosed. I, however, have received their annual audits from Protege. The 2016 figures for funds A, B and C were revised slightly from those originally reported last year. Fund D was liquidated in 2017; its average annual gain is calculated for the nine years of its operation.

The five funds-of-funds got off to a fast start, each beating the index fund in 2008. Then the roof fell in. In every one of the nine years that followed, the funds-of-funds as a whole trailed the index fund.

Let me emphasize that there was nothing aberrational about stock-market behavior over the ten-year stretch. If a poll of investment “experts” had been asked late in 2007 for a forecast of long-term common-stock returns, their guesses would have likely averaged close to the 8.5% actually delivered by the S&P 500. Making money in that environment should have been easy. Indeed, Wall Street “helpers” earned staggering sums. While this group prospered, however, many of their investors experienced a lost decade.

Performance comes, performance goes. Fees never falter.

* * * * * * * * * * * *

The bet illuminated another important investment lesson: Though markets are generally rational, they occasionally do crazy things. Seizing the opportunities then offered does not require great intelligence, a degree in economics or a familiarity with Wall Street jargon such as alpha and beta. What investors then need instead is an ability to both disregard mob fears or enthusiasms and to focus on a few simple fundamentals. A willingness to look unimaginative for a sustained period - or even to look foolish - is also essential.

Originally, Protege and I each funded our portion of the ultimate $1 million prize by purchasing $500,000 face amount of zero-coupon U.S. Treasury bonds (sometimes called “strips”). These bonds cost each of us $318,250 - a bit less than 64¢ on the dollar - with the $500,000 payable in ten years.

As the name implies, the bonds we acquired paid no interest, but (because of the discount at which they were purchased) delivered a 4.56% annual return if held to maturity. Protege and I originally intended to do no more than tally the annual returns and distribute $1 million to the winning charity when the bonds matured late in 2017.

After our purchase, however, some very strange things took place in the bond market. By November 2012, our bonds - now with about five years to go before they matured - were selling for 95.7% of their face value. At that price, their annual yield to maturity was less than 1%. Or, to be precise, .88%.

Given that pathetic return, our bonds had become a dumb - a really dumb - investment compared to American equities. Over time, the S&P 500 - which mirrors a huge cross-section of American business, appropriately weighted by market value - has earned far more than 10% annually on shareholders’ equity (net worth).

In November 2012, as we were considering all this, the cash return from dividends on the S&P 500 was 2.5% annually, about triple the yield on our U.S. Treasury bond. These dividend payments were almost certain to grow. Beyond that, huge sums were being retained by the companies comprising the 500. These businesses would use their retained earnings to expand their operations and, frequently, to repurchase their shares as well. Either course would, over time, substantially increase earnings-per-share. And - as has been the case since 1776 - whatever its problems of the minute, the American economy was going to move forward.

Presented late in 2012 with the extraordinary valuation mismatch between bonds and equities, Protege and I agreed to sell the bonds we had bought five years earlier and use the proceeds to buy 11,200 Berkshire “B” shares. The result: Girls Inc. of Omaha found itself receiving $2,222,279 last month rather than the $1 million it had originally hoped for.

Berkshire, it should be emphasized, has not performed brilliantly since the 2012 substitution. But brilliance wasn’t needed: After all, Berkshire’s gain only had to beat that annual .88% bond bogey - hardly a Herculean achievement.

The only risk in the bonds-to-Berkshire switch was that yearend 2017 would coincide with an exceptionally weak stock market. Protege and I felt this possibility (which always exists) was very low. Two factors dictated this conclusion: The reasonable price of Berkshire in late 2012, and the large asset build-up that was almost certain to occur at Berkshire during the five years that remained before the bet would be settled. Even so, to eliminate all risk to the charities from the switch, I agreed to make up any shortfall if sales of the 11,200 Berkshire shares at yearend 2017 didn’t produce at least $1 million.

2018年2月24日土曜日

ヨギ・ベラの卓見(ウォーリー・ワイツ)

0 件のコメント:
前回の投稿につづいて、ウォーリー・ワイツのインタビュー記事を引用します。今回の話題は「価格決定力」と「価値評価」についてです。ウォーレン・バフェットと同じように、ちょっとした冗談を折り込むのがワイツ氏も上手ですね。マネー・マネージャーとしての研鑽を積んでおられるようです。(日本語は拙訳)

<ロトンティ> 最近お書きになった文章の中で、「ほとんどの業界において企業側の価格決定力が弱くなった。それというのも、インターネットを利用して価格をすみやかに比較できる能力を、買い手側が手にしたからだ」としています。それではどのような種類の企業であれば、今もなお強力な価格決定力を確実に持っていると思いますか。

<ワイツ> 強力な価格決定力とは、手元に維持するのが難しいものです。今でもそれが存在すると考えられるのは、たとえばライセンスに守られた独自製品やニッチ製品、フランチャイズ契約、特許が挙げられます。また莫大な初期投資を必要とする事業であれば、優位性があるかもしれません。しかし資本がごく安価に調達できたり横溢している時期に、安全といえる企業はほとんどないでしょう。ほかには「ネットワーク効果」が発揮されることで、市場を「勝者の総取り」によって独占できるかもしれません。しかしこれも優位性が営々とつづくものは、きわめてわずかです。

<ロトンティ> 価値評価をどのように考えていますか。ディスカウンティド・キャッシュ・フロー(DCF)分析を使いますか。売却金額を定めていますか。また、好みの評価指標がありますか。たとえばPER、PBR、フリー・キャッシュ・フロー(FCF)利回りはどうですか。

<ワイツ> 私たちが信奉している理論が2つあります。第一に、「事業の価値は、将来得られるキャッシュ・フローを現在価値に割り引いたものである」こと。第二に、「事業価値は、いずれ株価に反映されるであろう」ことです。しかしヨギ・ベラが言ったように、「理論と実践に理論上の違いはないが、実践してみると違いはある」ものです。

おなじみの評価指標は、様々な文脈を考慮して使わなければ、ほとんど意味がありません。DCF分析も同様にかなり鈍い道具で、「科学的精度を有する」という幻想を生み出しかねません。以前からの冗談でこんなものがあります。「DCFで使う割引率と掛けて、ハッブル宇宙望遠鏡と解く」。その心は、「数度動かせば、別の惑星系が見える」。

そうであれ、私たちが念入りに調べる企業については、DCFモデルを必ず作成しています。ただしモデルが一点の場所として示す「価値」は、すなわち購入に踏み切れと指示するものではありません。しかしモデルを構築するアナリストはその作業を通じて、当該企業がどのように機能しているか必然的に理解することになります。またモデルが存在すること自体によって、私たちの投資検討チームが企業の魅力や価値を議論・討議しやすくなります。

FCFについて一点申し上げますと、その定義は使う人それぞれによって異なっています。私たちは「随意利用可能な」キャッシュ・フローの意味で使っています。これは保守・保全費用を支払った後の現金収支[原文はcash earnings]を指しており、成長を期した投資費用は含みません。一例をあげると、ホテルは客室を定期的に改装する必要がありますが、これは保守・保全費用になります。一方、新規の客室棟を建て増す場合は成長投資、すなわち「随意」分となります(この差異は財務諸表上で明確ではないこともありますが、違いがある点を認識しておくことが大切です)。

「売却目標」についてですが、企業価値の見積もりや計算に変更があったり、株価が満額あるいは割高だと思われたり、さらには資本投下先としてもっと魅力的な対象が他にある場合に売却します。

JR: You recently wrote that the pricing power of companies in most industries has decreased because of the shopper’s ability to quickly compare prices using the Internet. Which types of companies do you believe still have strong pricing power?

WW: Strong pricing power is hard to come by. Unique products and niches protected by licenses, franchise agreements, patents, etc. still exist. Businesses that require huge, upfront capital investments can have an advantage, but in a period of very cheap and abundant capital, few companies are safe. “Network effects” can lead to “winner take all” market dominance, but again, very few advantages are permanent.

JR: How do you think about valuation? Do you use discounted cash flow analysis? Do you set sell targets? Do you have a preferred valuation ratio such as price-to-earnings (P/E), price-to-book (P/B), free cash flow (FCF) yield?

WW: We believe in the theory that (1) the value of a business is the present value of its future cash flows and that (2) business value is likely to eventually be reflected in its stock price. However, as Yogi said, “In theory there is no difference between theory and practice. In practice, there is.”

Popular valuation ratios mean very little without lots of context. Discounted cash flow analysis is also a very blunt instrument which can create the illusion of scientific precision. There’s an old joke that DCF discount rates are like the Hubble Telescope…move it a couple of degrees and you’re in a different solar system.”

We do make DCF models on all the companies we get serious about, though. While the single point “value” that comes out of the model doesn’t dictate our buying decision, building the model forces the analyst to understand how the business works and the model itself facilitates discussion/debate among our investment team about the attractiveness and value of the business.

One note on “FCF”: Practitioners differ on the definition of “free cash flow.” We talk about “discretionary” cash flow. That is, cash earnings after maintenance capex but before growth investments. For example, regular refurbishment of hotel rooms is required - maintenance capex. Adding a new wing of rooms is discretionary - growth capex. (The difference may not always be clear from financial statements but the distinction is important.)

As for “sell targets,” we sell if our estimate or calculations change, if a stock becomes fully/over-valued, or if we have a more attractive alternative use of the capital.

さて本日2月24日(土)の夜10時には、バークシャー・ハサウェイの年次報告書(及び「バフェットからの手紙」)が公開される予定です。新たな副会長2名の件は、必ずや取り上げられることでしょう。また現在の金利環境についても触れそうな印象があります。そして、アップル社や暗号通貨の話題は登場するでしょうか。

2017年12月4日月曜日

S&P500に対する価値評価(GMO)

0 件のコメント:
今回は、ジェレミー・グランサム氏のファンドGMOのWebサイトで公開されている文書から、S&P500の価値評価(valuation)の状況について触れた文章を一部ご紹介します。(日本語は拙訳)

The S&P 500: Just Say No (Matt Kadnar and James Montier; GMO White Paper) [PDF]

S&P500に対する価値評価

我々が行うあらゆることの基盤となるものが、価値評価です。ですから、まずは現在のS&P500が受けている評価の状況に対して受託者スミス氏[説明省略]が抱いている悩みから始めましょう。はじめに独自のフレームワークを用いることで、我々が実施している価値評価を見て回ります。次に、リターンに寄与する要因を理解していきます。

どのような証券市場においても、発生するリターンは4つの要素に分解できます。長期的にみた場合、リターンは配当(成長及び利回り)によってのみ、ほとんどが説明できます。株式の保有者は「企業が長期的成長のために費やせるように」と資本を提供しているのですから、報酬を受ける必要があります。その報酬は、企業がリスキーな投資から生み出すキャッシュフローから利益や配当の形でまかなわれます。

証券という資産クラスを保有することで儲けをあげる際に、寄与する要因として他に考えられるものは、株価倍率(PER)そして利益率上昇の2つです(これらを合わせて「価値評価要素」と我々は呼んでいます)。それら4つの要素はひとつの個性を形成しています。つまり、リターンは常に4つの要素へと(事後的に)分解できるという性格です。図表1では、西暦1970年以降におけるS&P500のリターン[黒]を4要素(利益[青]、配当[黄]、利益率[えんじ]、PER[緑])に分解しています。利益率[えんじ]とPER[緑]は非常に長期にわたって、基本的に横ばいに推移してきました。前述したように長期間でみると、生じたリターンの多くは配当がもたらしています。


これと同じ分割手法を直近7年間に当てはめてみると、図表2に示すように異なった展開があらわれます。予想されるとおり、利益と配当は成長しています。しかし大幅に拡大したPER[緑]と利益率[えんじ]が4つの中で最も強く押し上げたことで、リターンに対して著しく寄与しています。これは短期間にみられるよくある例であり、価値評価要素の移り変わりがリターンの変動性を司っています。


もし利益と配当が見事なまでに安定していれば(現在はそのとおりですが)、「この7年間に味わったすばらしいリターンをS&P500が今後ももたらし続ける」と信じるのは、「この7年間と同じように、PERと利益率が今後も拡大し続ける」と信じるのと同じことになります。歴史を振り返ると、この仮定が存在した記録は、慎ましく言っても極めてわずかしか残されていません。「直近の状況が際限なく継続する」と仮定するのはおどろくほど容易なことですが、資産を扱う市場においてそのような仮定をするのは、この上なく危険です。おそらく現在のS&P500がそうであるように、割高な市場においては特にそうだと言えます。(p. 1)

Valuation of the S&P 500

The bedrock of everything we do is valuation, so let’s begin addressing Trustee Smith’s concerns with a look at the current valuation of the S&P 500. We will start our tour of valuation by examining our own framework. This in turn starts by understanding the drivers of return.

For any equity market, the return achieved can be broken down into four component parts. In the long term, the return is almost exclusively driven by dividends (growth and yield). Equity owners need to be compensated for providing capital to companies to help fund their long-term investments. That compensation comes from the cash flows the companies generate from their risky investments via earnings and dividends.

The two other ways to make money from owning an equity asset class are from multiple (P/E) or margin expansion (collectively we call these elements the valuation components). Together these four components make an identity - we can (ex post) always decompose returns into these factors. In Exhibit 1, we show a return decomposition for the S&P 500 since 1970 based on these four factors (earnings, dividends, margins, and P/Es). Margins and P/Es are basically flat over this very long time period. As we stated above, over the long term, the returns achieved have been delivered largely by dividends.

Using this same decomposition over the last seven years, we see quite a different story in Exhibit 2. Earnings and dividends have grown as one would expect, but P/E and margin expansion have significantly contributed to returns with multiple expansion actually providing the biggest boost of the four. This is typical of short-term periods, where the volatility of returns is dominated by shifts in the valuation components.

If earnings and dividends are remarkably stable (and they are), to believe that the S&P will continue delivering the wonderful returns we have experienced over the last seven years is to believe that P/Es and margins will continue to expand just as they have over the last seven years. The historical record for this assumption is quite thin, to put it kindly. It is remarkably easy to assume that the recent past should continue indefinitely but it is an extremely dangerous assumption when it comes to asset markets. Particularly expensive ones, as the S&P 500 appears to be.

2017年11月4日土曜日

2017年デイリー・ジャーナル株主総会(1)チャーリー・マンガーかく語りき

0 件のコメント:
バークシャー・ハサウェイの株主総会では、チャーリー・マンガーはウォーレン・バフェットの引き立て役としておとなしくしていますが、チャーリーが会長を務めるデイリー・ジャーナルの総会ではかなりの別人ぶりで、堂々とした独り舞台をみせています。距離が狭いこともあるせいか、参列者からの笑い声も頻繁にあがり、米国で一番楽しい総会かもしれません。


と、そのようなことを書けるのも、Youtubeに投稿されている映像を自宅で観られるからです。こちらのリンク先映像では投稿者の方が質疑項目ごとの目次を作成されており、ありがたいばかりです。(参列者爆笑シーンの一例は23分過ぎ)

Billionaire Charlie Munger: Advice for Business and Life (2017) (Youtube)

また別の方のサイトにはトランスクリプトがあります。

Charlie Munger: Full Transcript of Daily Journal Annual Meeting 2017 (HTML)

今回からの投稿では、今年の2月に開催された株主総会での質疑応答の様子を、上記の資料からご紹介します。今回の話題は、「ウォーレンが学び続けたことがバークシャー成功の要因だった」とする質疑の後半部分です(上記トランスクリプトのQ14)。バークシャーが2006年にイスカル社を買収したときの価格水準の話題と、航空会社への投資の話題です。(日本語は拙訳)

<チャーリー・マンガー> ベン・グレアムならば、イスカル社を買うようなことはしませんでしたよ。簿価の5倍になる金額を支払うのは、グレアムのやりかたではなかったですからね。ウォーレンはグレアムのもとで学びましたが、その後もずっとうまく学んだわけです。私自身も上手に学んできました。このゲームのいいところは、際限なく学び続けられる点ですね。実際のところ、今でもそうしていますから。

今や我々は、「突如として航空会社株を買うようになったのか」と報道されているのですよ。航空会社という商売について過去に我々がなんと発言していたか、覚えていますか。「そこまでひどいビジネスがあるとは、ご冗談でしょう」と考えていたのです。それが今では、航空会社関連の持ち株すべてを合わせると、中小の航空会社を1社分保有していることになります。我々は同じことを鉄道会社でもやりました。「鉄道なんてちっとも良かないね。事業者が多すぎて、トラックとの競争もあるし...」と言ったものです。80年間にわたってひどいビジネスだったことはたしかです。しかし彼の業界にはとうとう4つの大会社しか残っておらず、うまいビジネスへと変わりました。それと似たようなことが航空会社でも起きているわけですよ。

Ben Graham would have never bought Iscar. He paid 5 times book or something for Iscar. It wasn’t in the Graham play. And Warren who learned under Graham, just, he learned better over time. And I’ve learned better. The nice thing about the game we’re in, is that you can keep learning. And we’re still doing it.

Imagine we’re in the press…for all of a sudden (buying) airline stocks? What have we said about the airline business? We thought it was a joke it was such a terrible business. And now if you put all of those stocks together we own one minor airline. We did the same thing in railroads, we said “railroads are no damn good, you know there’s too many of them, truck competition…” And we were right it was a terrible business for about 80 years. But finally they got down to four big railroads and it was a better business. And something similar is happening in the airline business.

工具メーカーのイスカルに対して簿価の5倍を払ったという事実は、初見あるいは見逃していました。あくまでも個人的な見積もりですが、簿価5倍の買収水準はPER25倍から30倍になったとも考えられます。ウォーレンであれば出し渋りそうな金額です。しかし、うろ覚えですがイスカルの買収はチャーリーが熱を入れていたと記憶しています。そうだとすれば、ある程度の高値は納得できます。元から非公開企業だったのでイスカルの経営実態はよくわからないままですが、バークシャーの年次報告書によれば従業員数がこの10年間でほぼ倍増しており、着実に成長している様子がうかがえます。

2017年8月12日土曜日

インデックス投資において考慮すべき点(ハワード・マークス)

0 件のコメント:
ハワード・マークスの最新レターからもうひとつ、インデックス・ファンドなどのパッシブ投資に関する話題をご紹介します。今回は、彼の示す小気味よい考察に啓発されました。前回分はこちらです。(日本語は拙訳)

パッシブ投資及びETFについて

50年前になりますが、シカゴ大学の[経営]大学院に到着してすぐに、「市場効率性」のおかげで次のことを教わりました。第一に、資産価格はリスク調整後の利回りが妥当となるように決定されること。第二に、それに対する例外を一貫して見つけ続けられる者はいないこと、です。言い換えれば、「市場に勝つことはできない」とするものでした。私たちを教える先生たちはさらに、「各銘柄を少数ずつ買い付けることで、銘柄選定の専門家を上回る負けしらずの低コストな手段ができる」というアイデアを考え出しました。

その示唆を実践に移した人がジョン・ボーグルです。前年にバンガードを創設していた彼は、1975年に「ファースト・インデックス投資信託」を始めました。これが、商業ベースの大きさに達した最初のインデックス・ファンドです。S&P500を模倣するように設計されたその媒体は、のちに「バンガード・500・インデックス・ファンド」と改名されました。

インデックス連動あるいはパッシブ投資の考えはその後40年の間に徐々に成長し、2014年には株式投資信託における預かり資産の20%を占めるまでになりました。この10年間ほどはアクティブ運用者が概して劣った成績に甘んじていることや、ETFつまり売買の手間をより簡素にしてくれた上場投資信託が創設されたことを考慮すれば、アクティブ投資からパッシブ投資への移行は加速してきました。今日では強力な潮流となり、株式投信における全資産の37%を占めるまで拡大しています。この10年間にインデックス・ファンドやETFに流入した資金は、1兆4千億ドルでした(それに対して、アクティブ運用型の投資信託からは1兆2千億ドルが流出しました)。

投資におけるあらゆる流行と同様、パッシブ投資は次のような長所ゆえにあたたかく歓迎されています。

・ここ10年間前後をみると、パッシブなポートフォリオの成績がアクティブ投資を上回っていたこと。
・パッシブ投資であれば、インデックスに負けないことが保証されていること。
・パッシブな仕組みにかかる手数料や経費はずっと安価であり、アクティブ型の運用に対して永続的な優位を確立できること。

こういったことは、パッシブ投資やインデックス・ファンドやETFが不敗を企図したものだと述べているのでしょうか。いいえ、まったくもって違います。

・パッシブ投資家は「引けを取る」リスクからは保護されるものの、それと同時に「上回る」可能性を放棄することになる。
・アクティブ投資家の一部で近年の成績が平均に届かなかったことが、永続的ではなくて循環的なものだったことが明かされるかもしれない。
・この数年間の所産としてETFが約束している流動性は、特に高利回り債のような流動性の低い領域に投資するものほど、大規模な弱気相場での試練を受けていない。

さらに何点か、考慮に値することがあります。

まず、パッシブ投資という知恵がどこから生じたものなのか、思い出してほしいと思います。それは、「アクティブ投資家のとる行為が、妥当な資産価格を導いている」ことに信を置く点からです。だからこそ、割安なものが見当たらないことになります。しかし、株式投資の過半数がパッシブな運用によるものとなったら、一体どうなるでしょうか。おそらく価格は自由になって「妥当な水準」から発散し、割安銘柄(及び割高銘柄)が現在よりもありふれたものとなるに違いありません。それがすなわち「アクティブ運用者が勝利できる」約束とはならないものの、彼らの努力が実を結ぶために必要な条件を明らかに満たすことでしょう。

当社の顧客である年金基金で投資担当役員を務めている方から、次の質問を受けました。「うちの財務担当役員が提案してきたのですよ。アクティブ運用者はみんな放り出して、全資産をインデックス・ファンドやETFに投じようと。どうしたものですかね」。私からは単純な返答をしました。「ではその方に質問してみてください。投資する資産がどれだけの金額であれば、それを分析検討する者が皆無であっても、安心していられますか、と」。

「バスケット方式による機械的投資」によって、数兆ドルの資金が盲目的に動かされています。この呼び名は、ホライゾン・キネティクス・ファンドの[共同創業者である]スティーブン・ブレグマンが付けたものです。銘柄に対する価値評価に関してETFが疑問を抱くことはありません。すなわちファンダメンタルを分析する者がいないため、価格発見の面でなにも寄与しません。パッシブ投資へ資金がさらに移動するようであれば、アクティブ運用者のもとで働くアナリストの数は減少するでしょう。しかし同時に、パッシブ型ファンドのポートフォリオ構成を司るルールをだれが決めるのか、それについても思いを巡らせるべきです。

(この項つづく)

Passive Investing/ETFs

Fifty years ago, shortly after arriving at the University of Chicago for graduate school, I was taught that thanks to market efficiency, (a) assets are priced to provide fair risk-adjusted returns and (b) no one can consistently find the exceptions. In other words, "you can't beat the market." Our professors even advanced the idea of buying a little bit of each stock as a can't-fail, low-cost way to outperform the stock-pickers.

John Bogle put that suggestion into practice. Having founded Vanguard a year earlier, he launched the First Index Investment Trust in 1975, the first index fund to reach commercial scale. As a vehicle designed to emulate the S&P 500, it was later renamed the Vanguard 500 Index Fund.

The concept of indexation, or passive investing, grew gradually over the next four decades, until it accounted for 20% of equity mutual fund assets in 2014. Given the generally lagging performance of active managers over the last dozen or so years, as well as the creation of ETFs, or exchange-traded funds, which make transacting simpler, the shift from active to passive investing has accelerated. Today it's a powerful movement that has expanded to cover 37% of equity fund assets. In the last ten years, $1.4 trillion has flowed into index mutual funds and ETFs (and $1.2 trillion out of actively managed mutual funds).

Like all investment fashions, passive investing is being warmly embraced for its positives:

- Passive portfolios have outperformed active investing over the last decade or so.
- With passive investing you're guaranteed not to underperform the index.
- Finally, the much lower fees and expenses on passive vehicles are certain to constitute a permanent advantage relative to active management.

Does that mean passive investing, index funds and ETFs are a no-lose proposition? Certainly not:

- While passive investors protect against the risk of underperforming, they also surrender the possibility of outperforming.
- The recent underperformance on the part of active investors may well prove to be cyclical rather than permanent.
- As a product of the last several years, ETFs' promise of liquidity has yet to be tested in a major bear market, particularly in less-liquid fields like high yield bonds.

Here are a few more things worth thinking about:

Remember, the wisdom of passive investing stems from the belief that the efforts of active investors cause assets to be fairly priced - that's why there are no bargains to find. But what happens when the majority of equity investment comes to be managed passively? Then prices will be freer to diverge from "fair," and bargains (and over-pricings) should become more commonplace. This won't assure success for active managers, but certainly it will satisfy a necessary condition for their efforts to be effective.

One of my clients, the chief investment officer of a pension fund, told me the treasurer had proposed dumping all active managers and putting the whole fund into index funds and ETFs. My response was simple: ask him how much of the fund he's comfortable having in assets no one is analyzing.

As Steven Bregman of Horizon Kinetics puts it, "basket-based mechanistic investing" is blindly moving trillions of dollars. ETFs don't have fundamental analysts, and because they don't question valuations, they don't contribute to price discovery. Not only is the number of active managers' analysts likely to decline if more money is shifted to passive investing, but people should also wonder about who's setting the rules that govern passive funds' portfolio construction.

2016年2月22日月曜日

2016年デイリー・ジャーナル株主総会(4)企業価値評価について

0 件のコメント:
デイリー・ジャーナル社の株主総会の記事から、企業価値評価の話題です。今回の引用元記事は以下のリンク先になります。前回分はこちらです。(日本語は拙訳)

Charlie Munger on The Discount Rate (ValueWalk)

<質問> 根源的価値を算出する際に、割引率をどのように使っていますか。

<マンガー> そのようなやりかたで数式を使ってはいませんね。質的な各種の要因を考慮しているからです。ブリッジのハンドと同じで、さまざまなことを考慮にいれなければなりません[参考記事]。

公式などはないのですよ。そんなものがあれば、数学の得意な人はみんな金持ちになっています。ところが、そううまくはいかないのです。

<質問> ですが、企業の価値を判断するには...

<マンガー> 機会費用が大切ですね。それから無リスク金利も、要因のひとつではあります[参考記事の一例]。

<質問> 各企業に対して同じ利率を使うのですか。

<マンガー> もちろん違います。異なるビジネスには異なる利率を使いますね。それらはすべて価値の点から捉えた上で比較検討します。当然ながら、すぐれた企業に多めに払うのはOKです。米国ではお粗末な事業からでも儲けることはできますが、金を稼ぐという意味では骨の折れるやりかたです。ときに私たちも意図せずしてそうすることがありますが、あれは身内に無心するようなものですよ。できる限りの手は打ちますが、次のものを探そうなどとは考えていません。

Questioner: How do you use the discount rate to calculate intrinsic value?

Charlie Munger: We don't use numeric formulas that way. We take into account quality factors. It's like a bridge hand, you have to think about a lot of things.
There is never going to be a formula. If that worked, every mathematical person would be rich, but that's not the way it works.

Questioner: But you value a company…

Charlie Munger: Opportunity cost is crucial, and the risk free rate is one factor.

Questioner: Do you use the same rate for different businesses?

Charlie Munger: The answer is no, of course not, different businesses need different rates. They all are viewed in terms of value and weighed against one another. Of course we're OK paying more for a good business. In the US you can make money out of a lousy business. But it's a painful way to make money. Sometime we do it by accident, and in that case, it's like hitting up a relative, and we deal with those the best we can, but we're not looking for new ones.

2015年12月18日金曜日

事業を評価するには(ウォーレン・バフェット)

0 件のコメント:
ウォーレン・バフェットが今年の2月にウェスタン・オンタリオ大学の学生と面会した際の質疑応答その15です。このシリーズは次回が最終回です。前回分はこちらです。(日本語は拙訳)

<質問17> 事業を評価できるには何が必要ですか。

<バフェット> 企業のことをもっともうまく理解するには、まず業界について理解する必要があります。そして、自分が理解している企業や業界にだけ集中することです。自分の土俵の外に出てはいけません。競合に対してその企業はどんな強みを持っているのか、経営陣は優秀か、そしていちばん大切なのはmoat[モート;経済的な掘]が何か、これらを知っておく必要があります。競争相手が何社なのかわからないようでしたら、その会社に投資すべきではありません。コカ・コーラ社のmoatは後味が残らないことですし、鉄道会社のmoatは新設しようがないほど飽和している点です。それが、現在わたしが両業界に投資している理由です。

Question #17: What are the things that you need to be able to value a business?

Answer #17: In order to best understand a company, you first have to understand the industry. Only focus on companies and industries you understand. Don't go outside your circle of competence. You need to know what the strengths of the company are in relation to the competition, if they have a good management team, and most importantly, what the moat is. If you don't know how many competitors the company has, do not invest in the company. Coke's moat is that it has no taste accumulation, and the moat of railroad companies are that no one can build anymore because of saturation. That is why I am currently invested in both industries.

2015年7月18日土曜日

価値評価の実例:エスコ・エレクトロニクス社(3)(セス・クラーマン)

0 件のコメント:
セス・クラーマンの著書『Margin of Safety』から、第8章の価値評価に関するエスコ社の話題がつづきます。前回分はこちらです。(日本語は拙訳)

エスコ社に投資している者が、将来の業績について別のシナリオも検討したいと考えるのは、まずまちがいないだろう。たとえば、連邦政府との契約で係争となった案件のうち少なくとも1件が敗訴する可能性は明らかにあった。また広く予想されていた国防予算の削減が実現することで、同社にとって利益のあがる契約を失ったり新規に受注できなかったりする可能性も考えられた。新たに独立した同社はほとんどの競合他社よりも小規模だったために、エマーソン社を離れて事業を進める上で困難に直面する可能性もあった。

それとは別の見方として、連邦政府との契約に関する訴訟でエスコが完勝するか、あるいは容認できる条件で和解する見込みも考えられた。実のところ新たな経営陣は、過去の難題はさっさと忘れて心機一転したいと考えていたようだ(実際にその係争は、スピンオフした何ヶ月後かにエスコ社にとって好ましい条件で暫定的な合意に達した)。さらにその新経営陣は「自分たちのねらいが売上よりもキャッシュフローを最大化することにある」との意向を示した。新規の契約が承認される際には、名声を得たかったり売り上げ増を達成したいとの願いではなく、収益性の面でリスクが小さいことが判断基準となるのだ。そのため、「不採算の契約が完了して採算のとれる契約が加わることで、利益が次第に増加していく」とする見方はそれなりに妥当な考えだった。

また正味現在価値分析だけでなく、他の評価手段も考慮したいと考えるかもしれない。しかしこのエスコ社の事例では相対取引価値分析は適用できなかった。というのも、それなりの規模となる国防関連企業の買収案件が近年はほとんどなかったからだ。仮にあったとしても、エスコ社を丸ごと買収しようと望む者はだれであろうと、破格の安値であればともかく、同社が抱えていた係争中の案件によって意欲を削がれただろう。実際のところ、スピンオフに先立ってエスコ社の売却話が打診されたが、エマーソン社が許容できる価格で名乗り出た買い手は皆無だった。

その反対に、エマーソン社がハゼルティン社をわずか4年前に買収した際には1億9千万ドルを支払ったが、ハゼルティンはスピンオフ時点のエスコ社が営む事業のわずかな部分を占めるにすぎなかった。ハゼルティン案件に近い倍率で買収金額を考えたとしても、エスコ社全体の価値はその時点の株価の何倍にもなっただろう。ハゼルティン社分だけでもエスコ社1株あたり15ドルの価値があったのだ。

Investors in Esco would certainly want to consider alternative scenarios for future operating results. Obviously there was some chance that the company would lose one or more of its contract disputes with the U.S. government. There was some possibility that a widely anticipated reduction in national defense spending would cause the company to lose profitable contracts or fail to receive new ones. There was a chance that the newly independent company, smaller than most of its competitors, would face difficulties in trying to operate apart from Emerson.

Alternatively, there was some prospect that Esco would either win both of its contract disputes outright or settle with the government on acceptable terms. Indeed, the new top management would likely wish to start afresh, putting past difficulties behind them. (The disputes were, in fact, tentatively settled within months of the spinoff on terms favorable to Esco.) Further, new management expressed its intention to maximize cash flow rather than sales; new contracts would be accepted on the basis of low-risk profitability rather than prestige or the desire to achieve revenue growth. Thus it was not unreasonable to think that earnings would grow over time as unprofitable contracts were concluded and profitable contracts added.

Investors would want to consider other valuation methods in addition to NPV. The private-market value method, however, was not applicable in the case of Esco because there had been few recent business transactions involving sizable defense companies. Even if there had been, Esco's pending contract disputes would put a damper on anyone's enthusiasm to buy all of Esco except at an extreme bargain price. Indeed Esco had been put up for sale prior to spinoff, and no buyers emerged at prices acceptable to Emerson.

Conversely Emerson had only four years earlier paid $190 million for Hazeltine, which comprised only a fraction of Esco's business at the time of spinoff. At a takeover multiple even close to that of the Hazeltine transaction, all of Esco would be worth many times its prevailing stock market price, with Hazeltine alone worth $15 per Esco share.

2015年7月8日水曜日

価値評価の実例:エスコ・エレクトロニクス社(2)(セス・クラーマン)

0 件のコメント:
毎度ながら少し間隔があきましたが、マネー・マネージャーのセス・クラーマンの著書『Margin of Safety』、第8章の価値評価に関する話題のつづきです。前回分はこちらです。(日本語は拙訳)

1990年10月時点でのエスコ社の価値を評価するためには、業績を理解することからはじめた。つまり利益とキャッシュフローである。エスコ社があげる将来の利益を予測するのは殊にむずかしい作業だった。特に直前2年間の各年度において、多額の非継続性損失を計上したからだ。ベアー・スターンズ社のアナリストは、1991年の会計年度における利益を収支トントンと予測していた。その数字には、新しく設定された740万ドルの費用が含まれていた。これは1991年から1995年に毎年発生するエマーソン社向けの債務で、継続中だった国防関連の契約を保証するものだった。この支出によって当該5年間の報告利益が減少することになるが、これは特殊なもので、真の事業の姿を示す費用ではなかった。

利益を抑制しつづけた他の要因として、ハゼルティン社買収によって損金不算入分ののれん償却費が年額500万ドルほど発生していた件があった。のれんの償却費用は現金の支出を伴わないので、これに由来するだけでも500万ドルすなわち1株当たり45セントのフリー・キャッシュフローが生じた。

正味現在価値分析によってエスコ社の価値をはかるには、同社が将来実現できそうなキャッシュフローを予測する必要がある。今ふれたように1株当たり45セントになるのれん償却費はフリーキャッシュだった。また740万ドルの保証費用がなくなる1996年からは、税引き後利益に45セントが追加される。さらに将来の利益を考える上では、いくつかの点を仮定する必要があった。

妥当な仮定のひとつとしておそらくもっとも可能性が高いものが、現在はゼロである利益の額が少しずつ増加する見方だ。不採算の案件はいずれ終結するし、キャッシュフローの留保分からは利子が得られる。もうひとつ別の見方としては、当時の停滞した業績水準が無期限に継続する可能性が考えられた。

キャッシュフローを評価するためには、将来の利益を予測することに加えて、今後行うと考えられる事業での支出を伴う投資や投資引き揚げを見積もる必要がある。例えば近年の減価償却費はおおよそ設備投資額に相当していたので、それが将来も続くと想定するのは保守的な見方だと思われた。また継続中の不採算案件に拘束されている運転資本は、時期は不定ながらもいずれは解放されて他の用途に回すことができる。売上高とくらべた運転資本の比率はその時点では過大だったものの、国防に関連する電子業界での同様な他社と比較できる水準になれば、利用可能な現金におよそ8,000万ドルが加わるだろう。ただし保守的な見方のほうでは、ここから生じる分のフリー・キャッシュフローは見込まないこととした。

低迷する業績水準から脱却できないままだとしたら、エスコ社の価値はどう考えられただろうか。キャッシュフローの面で5年間は1株当たり45セント、その後はエマーソン社に対する保証費用が終了するので90セントになる。割引率を12%あるいは15%とすると、それらの現在価値は1株当たり5.87ドルあるいは4.7ドルとなった。各々の割引率には想定される不確実性を反映している。もしキャッシュフローが増加するとなれば、当然ながら価値も増大する。

一方、横ばいだったエスコのキャッシュフローを、10年間にわたって毎年約220万ドルつまり1株当たり20セント増加させることができたらどうなるだろうか。それらを含めた金額を12%あるいは15%で割り引いた際の現在価値は、14.76ドルあるいは10.83ドルになる。つまり上述した諸々の仮定にしたがうと、エスコ社の現在価値は保守的な見方では1株当たり4.7ドル、悲観しない見方では14.76ドルと算出された。たしかに広い幅ではあるが、どちらの場合でも3ドルの株価は十分に上回っており、またひどく楽観的な仮定もしていなかった。(p.138)

The first step in valuing Esco in October 1990 was to try to understand its business results: earnings and cash flow. Esco's future earnings were particularly difficult to forecast, especially because in each of the preceding two years the company had taken significant nonrecurring charges. An analyst at Bear Steams estimated break-even earnings for fiscal year 1991. This estimate was after the deduction of a newly instituted charge of $7.4 million, payable by Esco to Emerson each year from 1991 to 1995, for guaranteeing outstanding defense contracts. Although this charge would have the effect of reducing reported earnings for five years, it was not a true business expense but rather more of an extraordinary item.

Another ongoing depressant to earnings was Esco's approximately $5 million per year charge for nondeductible goodwill amortization resulting from the Hazeltine acquisition. Since goodwill is a noncash expense, free cash flow from this source alone was $5 million, or forty-five cents per share.

In order to value Esco using NPV analysis, investors would need to forecast Esco's likely future cash flows. Goodwill amortization of forty-five cents a year, as stated, was free cash. Beginning in 1996 there would be an additional forty-five cents of after-tax earnings per year as the $7.4 million guaranty fee ended. Investors would have to make some assumptions regarding future earnings.

One reasonable assumption, perhaps the most likely case, was that earnings, currently zero, would gradually increase over time. Unprofitable contracts would eventually be completed, and interest would be earned on accumulated cash flow. An alternative possibility was that results would remain at current depressed levels indefinitely.

In addition to predicting future earnings, investors would also need to estimate Esco's future cash investment or disinvestment in its business in order to assess its cash flow. Depreciation in recent years had approximated capital spending, for example, and assuming it would do so in the future seemed a conservative assumption. Also, working capital tied up in currently unprofitable contracts would eventually be freed for other corporate uses, but the timing of this was uncertain. Were Esco's working capital-to-sales ratio, currently bloated, to move into line with that of comparable defense electronics firms, roughly $80 million in additional cash would become available. To ensure conservatism, however, I chose to project no free cash flow from this source.

What was Esco worth if it never did better than its current depressed level of results? Cash flow would equal forty-five cents per share for five years and ninety cents thereafter when the guaranty payments to Emerson had ceased. The present value of these cash flows is $5.87 and $4.70 per share, calculated at 12 percent and 15 percent discount rates, respectively, which themselves reflect considerable uncertainty. If cash flow proved to be higher, the value would, of course, be greater.

What if Esco managed to increase its free cash flow by just $2.2 million a year, or twenty cents per share, for the next ten years, after which it leveled off? The present value of these flows at 12 percent and 15 percent discount rates is $14.76 and $10.83, respectively. Depending on the assumptions, then, the net present value per share of Esco is conservatively calculated at $4.70 and less pessimistically at $14.76 per share, clearly a wide range but in either case well above the $3 stock price and in no case making highly optimistic assumptions.

2015年7月2日木曜日

なにもかも知る必要はない(スティーブン・ローミック)

0 件のコメント:
バリュー志向のファンド・マネージャーであるスティーブン・ローミック氏は、個人的に尊敬しているマネージャーのひとりです。彼が最近講演した内容がファンドのWebサイトに掲載されていたので一読しました。楽しんで読め、全編が参考になりました。徹底したバリュー投資家である彼のファンドでは現金比率を高めており、同業者やインデックスとの比較という意味で厳しい時期のようです。しかし、みずからの方針に疑念を抱かぬ彼がふたたび称賛される日がやってくる可能性は高いと思います。

今回は同文書から2か所を引用します(図表も同じ文書から引用)。ひとつめが米国の債務に関する話題で、もうひとつは彼の投資スタイルについてです。(日本語は拙訳)

Don't Be Surprised - Steven Romick's speech to CFA Society of Chicago [PDF] (FPA)

2008年以来、米国での家計及び金融部門における債務の減少幅は3兆3千億ドルでした。しかし政府部門の債務は6兆7千億ドル増加し、政府と民間を合計した全債務の22%を占めています。6年前とくらべると10ポイント増加しています。

政府自身が輪転機を保有しているので、債務返済の面で個人や企業と同じ原理には拘束されていません。しかし10年前には量的緩和という言葉を聞いたことはなかったのですが、現在の中央銀行はあらゆるものが釘であるかのように、そのかなづちを振るっています。わたしが想像したいと考える以上に、このゲームは長期間つづくかもしれません。その間には通貨価値が潜在的に減価していく影響を伴うでしょう。(PDFファイル11ページ目)


Since 2008, total U.S. household and financial sector debt declined $3.3 trillion but government debt has increased $6.7 trillion and now represents 22% of total public and private debt, up ten percentage points from 6 years ago.

Since governments own printing presses, they are not bound by the same debt repayment principles as individuals and corporations. I hadn't heard of quantitative easing a decade ago and now central bankers are using that hammer as if everything is a nail. So, the game can be afoot for longer than I care to imagine, with a potential long-term impact of undermining currencies.

そのためわたしたちは、すばらしい企業をまずまずの値段で、あるいはそこそこの企業を破格の値段で買える機会をみつけることに力を尽くしたいと考えます。その際には単純にやっていきたいと思います。打ち明けますと、いつでもそうしてきたわけではないです。初期の頃には、かなり深入りしていました。企業やその業界のことは全部知っていないと済まない性質でした。そこから学んだことがあります。たくさん知らなくても大丈夫だということ、つまりその会社を動かしているものを一つから三つ特定できればいい、ということです。精確さを追求しても得られるものは少ないと強く感じています。それよりも、結果のとりうる範囲を見極めるほうをえらびます。厳密にやってまちがえるよりも、正しい方角を向いていたいと考えます。

わたしたちは次のような問いに答えるために、多くの時間を費やしています。「この事業はいかにして動いているのか」「なぜこの機会が存在するのか」、その上で「もしそうだとしたらどうなるのか」。投資で成功するには、勝者をみつけるのと同じように敗者を避けることも大切です。それがわかったことでわたしたちは、「好ましい主張を逆転させて、薄暗い色のメガネでみつめる」やりかたをとるようにしました。喜ばしいことにそういったすべてが、寝耳に水のありがたくない事態を減らしてくれるのです。

株式に付けられている値段がちがうと、問いかけられる質問もちがうものになります。値段が高いときとくらべると安いときのほうが、答えるべき質問は少ない数で済みます。たとえばコンテナ船を擁する会社に対して、所有する船団をスクラップにした価値しか考慮しない値段がついているとします。そのときには二つ三つの問いに答えれば十分です。「市場が反転するまでに現金がどれだけ費消されうるのか」「財務の状況はそれを支えられるのか」といった質問です。反対に、同じコンテナ船会社のキャッシュフローが現在良好だとします。デイ・レート[1日当たりの傭船料]が高く、簿価の2倍の株価で取引されているとします。その場合にはデイ・レートの水準がどれだけ継続するかにかかってくるでしょう。そしてさらに問われるのが「経営陣がフリー・キャッシュフローを賢明に使うかどうか」です。先にあげた例では、資本配分の意思決定についてはあまり気にする必要がありませんでした。フリー・キャッシュフローと資金的な柔軟性のどちらも欠けていたからです。

今日わたしたちが目を通している価値評価基準のどれもが、企業がいっそう高いほうへ取引されていることを示しています。つまり、さらにむずかしい質問が増えて、その答えをみつけるのにもっと奮闘しなければならないことを意味しています。(PDFファイル12ページ目)

1998年のスティーブン・ローミック氏(当時34歳)、Money誌の表紙に。

We will therefore continue to focus our energies on the search for great businesses at good prices or decent businesses at great prices. We try and keep it simple. I confess that I didn't always operate this way. In my early years, I ended up too much in the weeds. I had to know everything about a company and its industry. I've since learned that knowing less is okay as long as you have identified the one to three things that will drive the company. We believe exactness offers little so we prefer to establish a potential range of outcomes instead. We'd rather be directionally right rather than precisely wrong.

We spend a lot of time asking such questions as: "How does the business work?" "Why does this opportunity exist?" And then, "What if?" Knowing that successful investing is as much about finding winners as it is about avoiding losers, we invert a favorable thesis so as to see it through less rose-colored lenses, all of which hopefully limits negative surprises.

Stocks ask you different questions at different prices. One needs fewer answers at a low price versus a high price. For example, a container ship company priced as if its vessels are worth just scrap value requires only a couple of questions like, "How much cash might be burned before the market rebounds?" and "Can its balance sheet support that?" Whereas if you bought that same container ship company with good current cash flow but day rates are at highs and its stock is trading at two times book value, you'd be far more dependent on the sustainability of the day rate. You'd then have to ask whether or not the management team would spend their free cash flow wisely. In the first case, you'd worry less about their capital allocation decisions because they'd be lacking free cash flow and financial flexibility.

Today, every valuation measure we see points to companies trading on the more expensive side. That means a lot more difficult questions and more of a struggle to find the answers.